
The RSI forex trading strategy is an intraday forex trading strategy that combines the Sadukey, Forex Analyzer Pro and RSIFilter custom indicator. Open positions on this strategy can hold for hours before their expiration and as such it is suitable for traders who can hold positions for hours during the day’s session.
Chart Setup
MetaTrader4 Indicators: Sadukey.ex4 (default setting), Forex Analyzer Pro (default setting), RSIFilter.ex4 (14)
Preferred Time Frame(s): 5-Minutes, 15-Minutes, 30-Minutes, 1-Hour, 4-Hours
Recommended Trading Sessions: Any
Currency Pairs: Any
Download RSI Forex Trading Strategy.
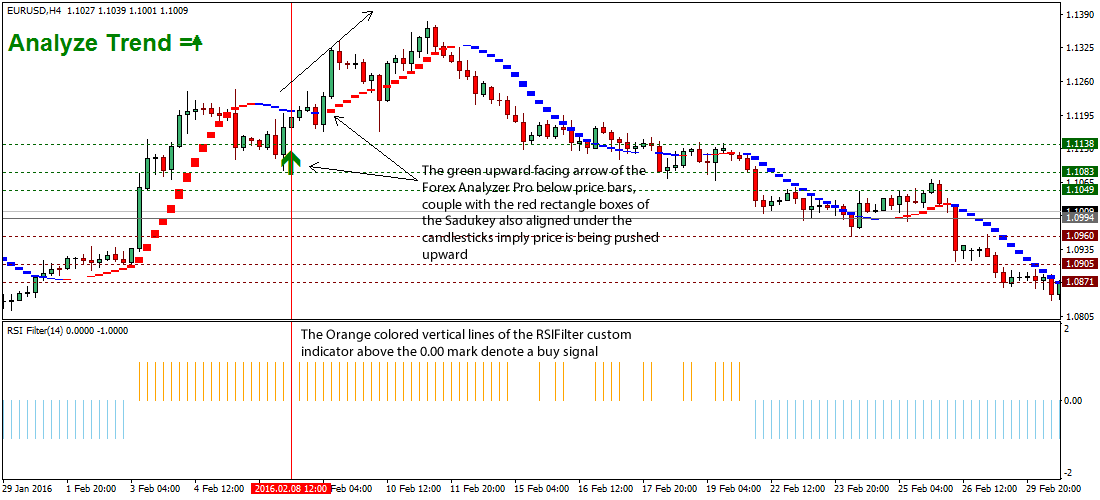
Buy Example (click the image for full size):

Fig. 1.0
Strategy
Long Entry Rules:
The following indicator or chart patterns will endorse a buy entry:
- When the red colored rectangle boxes of the Sadukey custom indicator forms below the candlesticks, implying that price is getting an upward kick.
- The green arrow of the Forex Analyzer Pro custom indicator is aligned below price bars, points upward and thus indicates that price is bullish.
- The Orange colored vertical lines of the RSIFilter custom indicator above the 0.00 level imply that price is heading northward and as such a bullish trend is underway.
Stop Loss for Long Entry: Place stop loss on key S2 level below the green arrow of the Forex Analyzer Pro.
Exit Strategy/Take Profit for Long Entry
Find below some of the conditions for that should define an exit and/or take profit strategy for long entry:
- A blue colored rectangle of the Sadukey custom indicator that forms above the candlesticks, indicates that trend is weakening and a reversal is underway.
- A red downward facing arrow of the Forex Analyzer Pro custom indicator that is aligned above price bars indicates that price is on its way down.
- The SkyBlue colored vertical lines of the RSIFilter aligned below the 0.00 mark indicates that downward pressure is developing.
If all three conditions are present on the activity chart, then it is a green light for an exit and/or take profit.
Sell Entry Rules
Initiate a sell entry when the following conditions are defined on the activity chart:
- The formation of the blue rectangles of the Sadukey custom indicator above price bars is an indication that price is being pushed lower and a bearish trend is in the making.
- The red arrow of the Forex Analyzer Pro custom indicator points downward (usually aligned above price bars), indicates that price is being pushed lower and a bearish signal is in place.
- The SkyBlue colored vertical lines of the RSIFilter shows that price is heading southwards.
Stop Loss for Sell Entry: Place stop loss on key R2 level above the red arrow of the Forex Analyzer Pro.
Exit Strategy/Take Profit for Sell Entry
Watch out for the following chart or indicator pattern before exiting and/or taking profit from a trade:
- Red colored rectangles of the Sadukey custom indicator show up below price bars, an indication that the existing trend is weaning.
- If the Forex Analyzer Pro’s arrow turns blue and faces upward, a strong reversal is underway.
- The RSIFilter custom indicator’s Orange colored vertical lines denote a strong bullish trend, subsequently an exit is advised.

Fig. 1.1
Free Download
Download The RSI Forex Trading Strategy.
About The Trading Indicators
The Sadukey is a trend following indicator that is designed to detect trend via blue rectangular dots that suggests sell alerts while the red colored rectangular dots are meant to define bullish signals.
The RSIFilter is an oscillator that is built on the RSI indicator, offering traders clues as to when the market is overbought or oversold.
The Forex Analyzer PRO custom indicator also has its colored (red & green) arrows aligned to the upside and downside.
The indicator plots support and resistance levels on the chart as well, which are of course a great way of measuring price action alongside the indicator arrow alerts.